MoreExam
1. Question Content...
EXPLANATION
Answer: X - EXPLANATION Content.
Question1: You have a large data source that contains more than 10 million rows. Users can filter the rows by a field named Animal.The following is a sample of the data.You want to improve the performance of the views by including only animals of a particular type.To which filter should you add the Type field on the worksheet?
Question2: Open the link to Book1 found on the desktop. Open the sales dashboard.Add the Sales by State sheet in a Show/Hide button to the right side of the dashboard.
Question3: You have two tables named Employeelnfo and DepartmentInfo. Employeelnfo contains four fields named Full Name, Department ID, Start Date, and Salary.DepartmentInfo contains four fields named Department Name, Size, Department ID, and VP.You want to combine the tables to meet the following requirements:. Each record in Employeelnfo must be retained in the combined table.. The records must contain the Department Name, Size, and VP fields.* Every record must have a full name.Which type of join should you use?
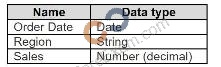
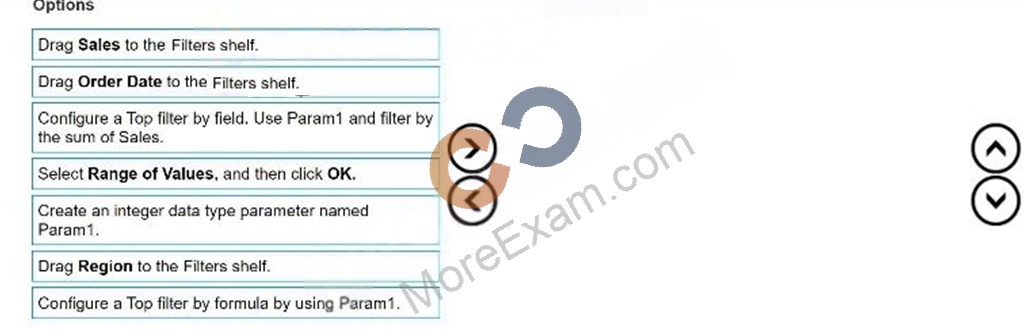
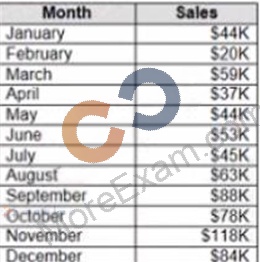
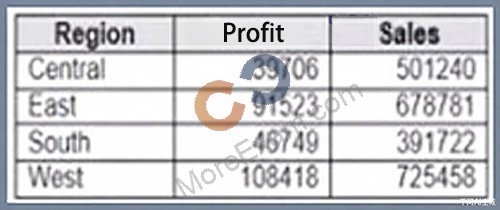
Question4: You have a data source that contains the following columns.You want to filter regions based on the highest sales. Users must be able to specify the number of regions shown.Which three actions should you perform in order? (Place the three correct options in order. Use the arrows to move Options to Answer Area.Use Answer Area arrows to re-order the options.)
Question5: You have a data source that has two tables named Table1 and Table2. Table1 is the primary table and Table2 is the secondary table.You want to combine the tables by using Tableau Prep. The combined table must include only values from Table1 that do NOT match any values in Table2. The field values from Table2 must appear as null values.Which type of join should you use?
Question6: Open the link to Book1 found on the desktop. Open Disciplines worksheet.Filter the table to show the members of the Top10 set and the members of the Bottom10 set. There should be a total of 20 rows.
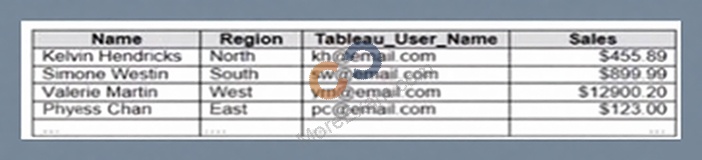
Question7: You have the following dataset.You plan to create a dashboard that will be filtered to show only data that is relevant to a specific Tableau user based on the Tableau_User_Name field You need to create a boolean calculated field to place on the data source finer Which formula should you use for the filter?
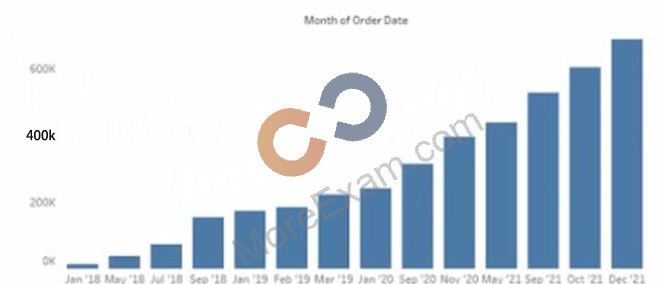
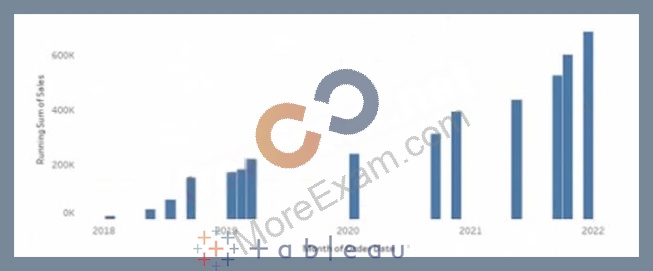
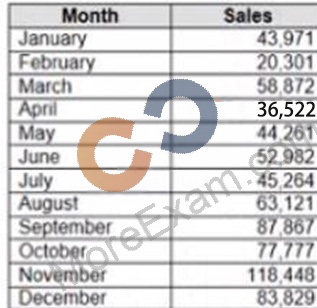
Question8: You have the following chart that shows the cumulative of sales from various dates.You want the months to appear as shown in the following chart.What should you do?
Question9: You plan to create a Tableau subscription for several users.Which two formats can you use? Choose two.
Question10: You have a workbook that uses an extracted data source.You publish the workbook to Tableau Server.Which three actions can you perform from the Extract Refresh page in Tableau Server? Choose three.
Question11: You want to connect a Tableau workbook to a dataset in a Microsoft Excel spreadsheet.What should you do from Tableau Desktop?
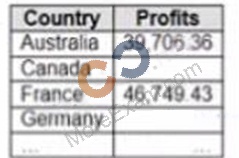
Question12: You have the following dataset that contain null values in the Profits field.You want the data to appear as shown in the following table.Which two formulas achieve the goal? Choose two.
Question13: You have the following worksheet.You want to create a table calculation that shows sales growth over each year.How should you complete the formula? (Use the dropdowns in the Answer Area to select the correct options to complete the formula.)
Question14: You have a table that contains the following data.How should you complete the formula? (Drag the appropriate Options to the Answer Area and drop into the correct locations.)
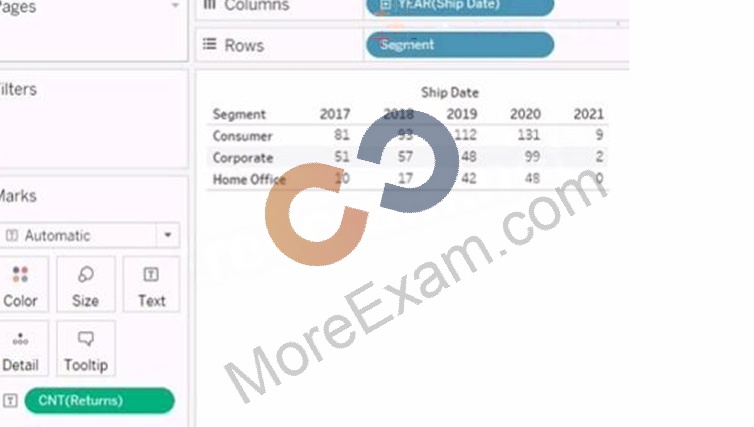
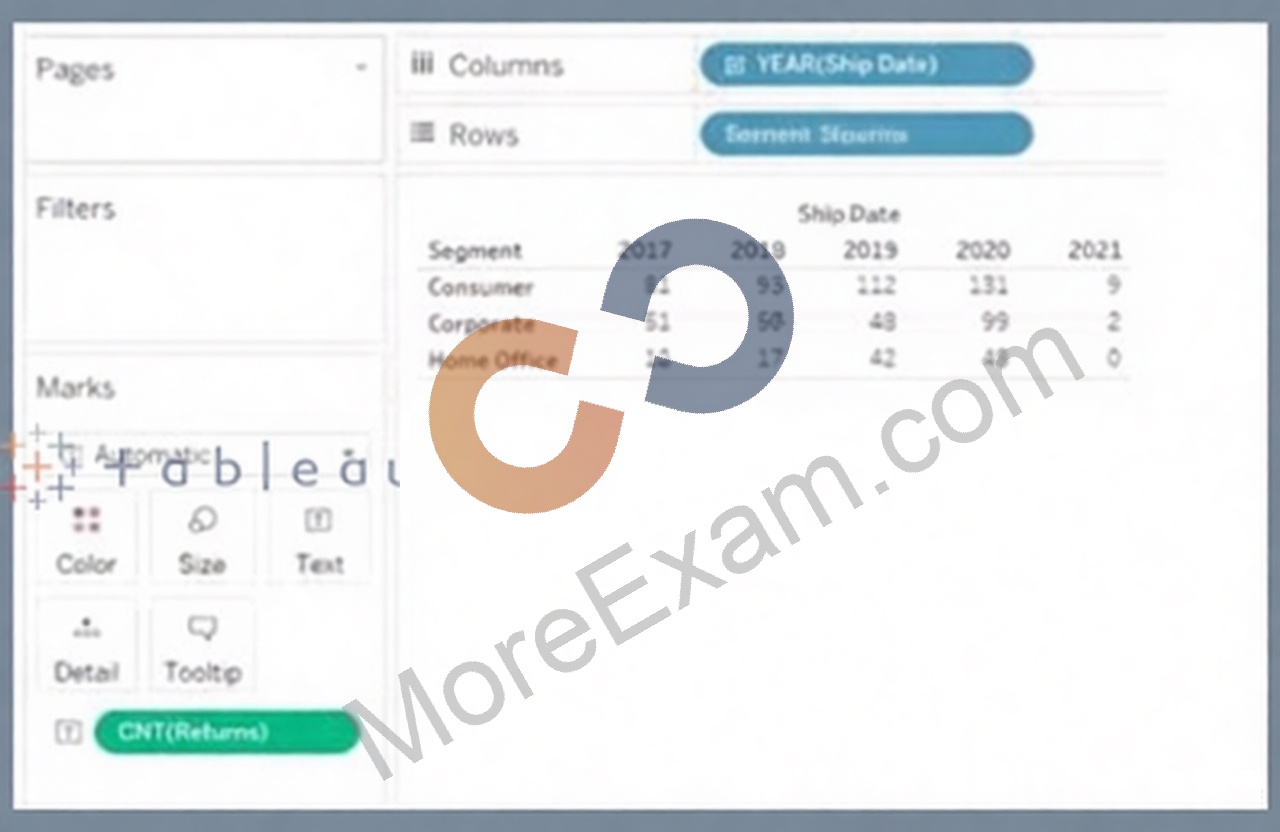
Question15: You have the following visualization.You want the count of Returns displayed only for the first year in the table.How should you complete the formula in the calculated field? (Use the dropdowns in the Answer Area to select the correct options to complete the formula.)
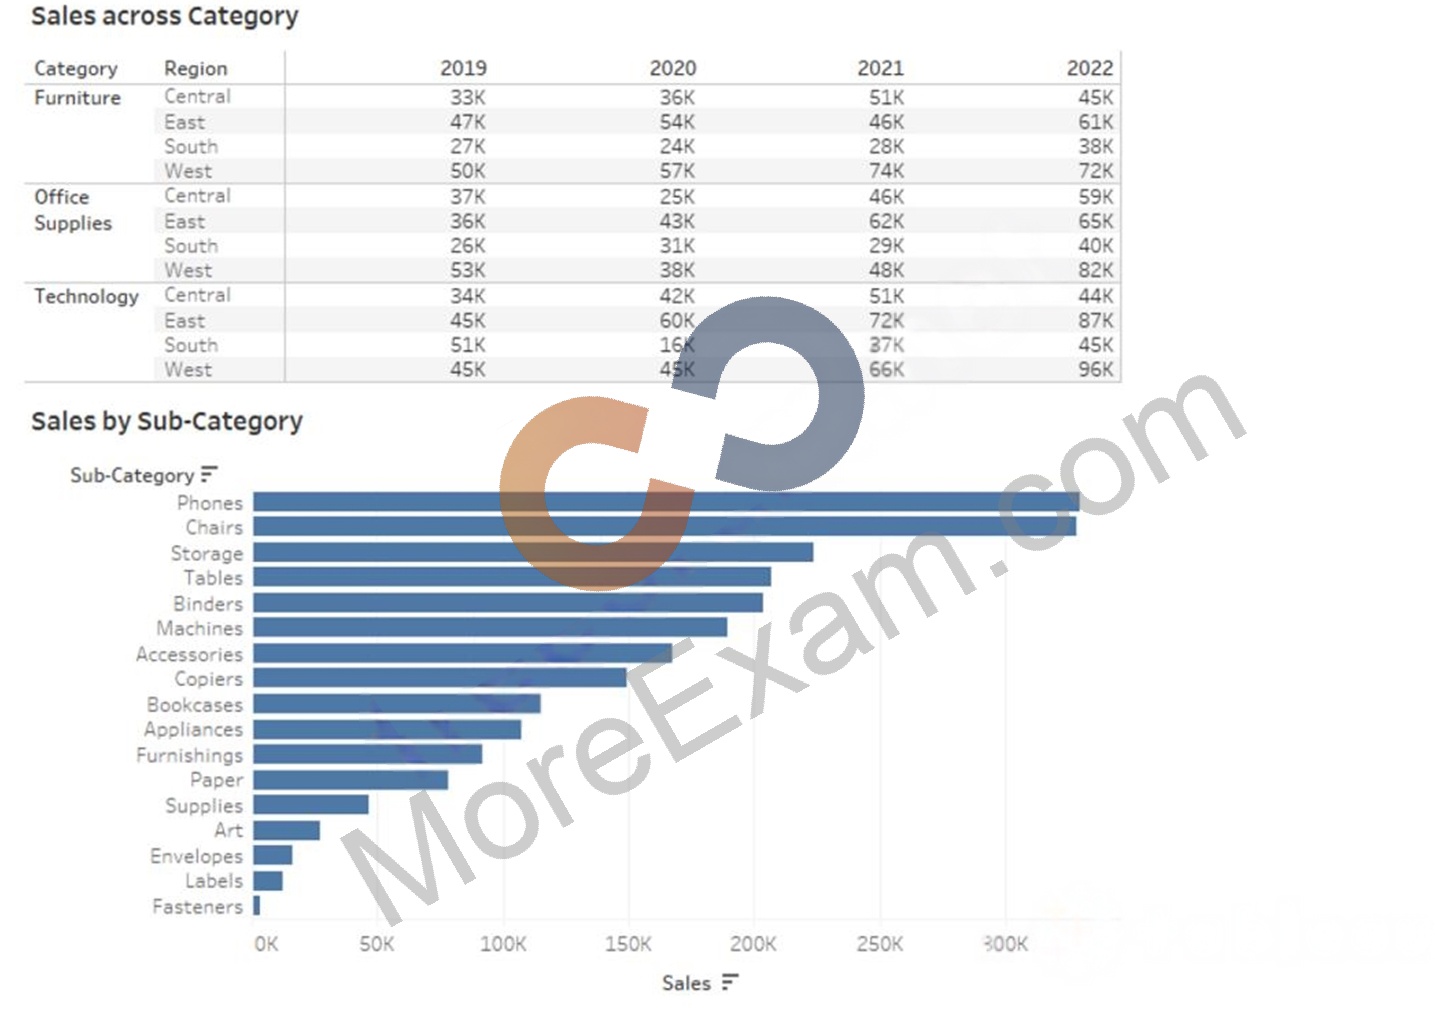
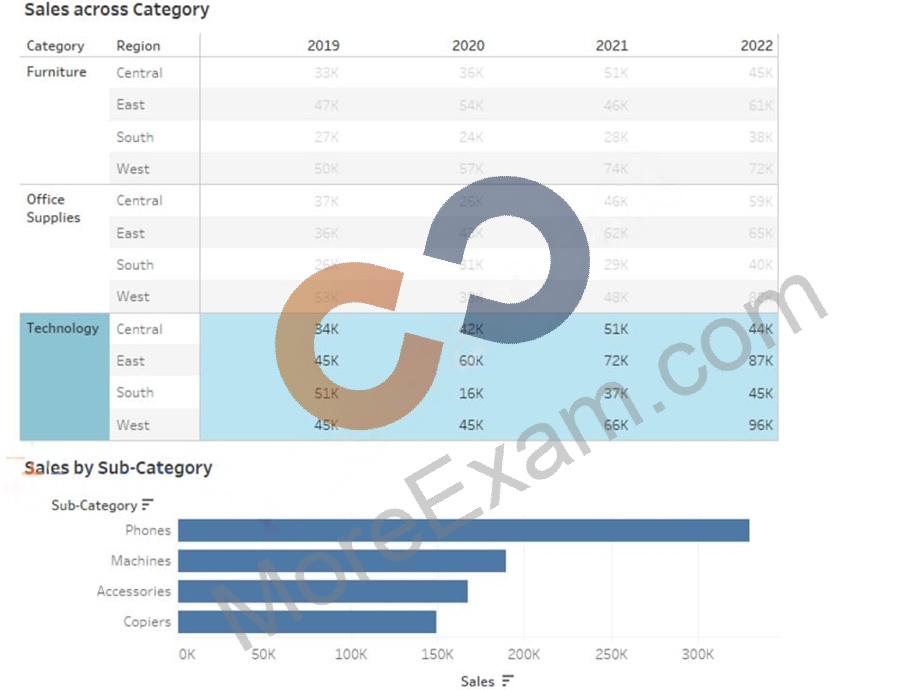
Question16: You want to create the following dashboard.The dashboard will contain two sheets that will connect to the same data source. The top sheet will be configured to filter the bottom sheet.When you click a category on the top sheet, the sheets must resize as shown in the following exhibit.How should you lay out the objects on the dashboard?
Question17: You have the following dataset.When you use the dataset in a worksheet, you want Sales to appear automatically as shown in the following table.What should you do?
Question18: You plan to create a visualization that has a dual axis chart. The dual axis chart will contain a shape chart and a line chart will use the same measure named Population on the axis.You need to configure be shapes to be much larger than the line.What should you do?
Question19: You have the following data source in tableau Server.You need to ensure that the data is updated every hour.What should you select?
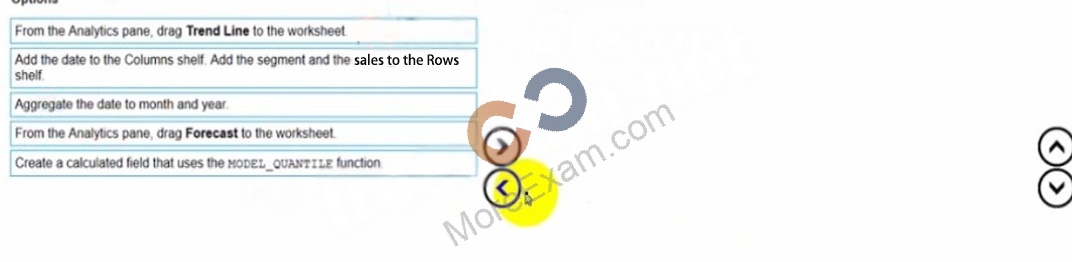
Question20: You have a dataset that contains daily sales by business segment from 2017 to the present You want to use monthly historical trends to predict sales by segment in the future Which three actions should you perform m order?(Place the three correct options in order Use the arrows to move Options lo Answer Area I In Answer Area arrows to re order the options.)
Question21: You are creating an annual report in Microsoft Word.In Tableau Desktop, you build a chart in a worksheet.You want to create an image of the chart that you can add to the annual report.What are two ways to create the image? Choose two.
Question22: You have the following dataset.You need to generate the results in the Day field.How should you complete the formula? (Use the dropdowns in the Answer Area to select the correct options to complete the formula.)
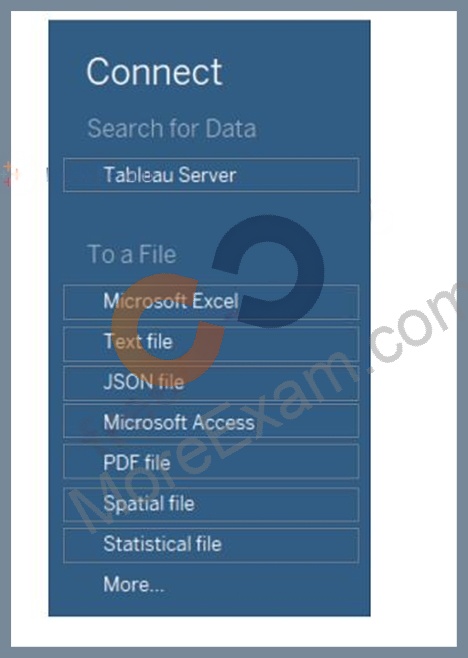
Question23: You receive a tab-delimited data file name sales.tsv.You need to connect to the file.Which option should you select in Tableau Desktop?
Question24: Open the link to Book1 found on the desktop. Open Disciplines worksheet.Filter the table to show the Top 10 NOC based on the number of medals won.
Question25: You have a data source that contains data tor every city in the Unites States. The following is a sample of the data.You need to use the City dimension to create a dynamic filter that snows the cities that have a population greater than one million Which type of filter should you use?
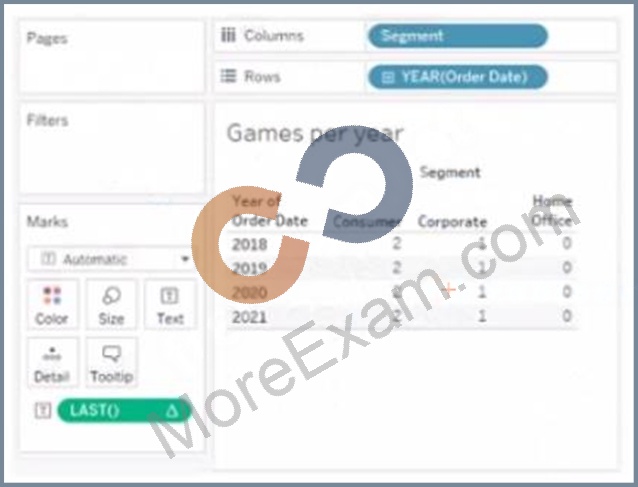
Question26: You have the following visualization.The Last() calculation is set to compute using Table (across)Which value will appear in the crosstab for the Consumer segment of the year 2018 if you change compute to use Oder Dale?
Question27: You have the following visualization.
Question28: Open the link to Book1 found on the desktop. Use the Superstore data source.Split the Customer Name field into two fields named First Name and Last Name.
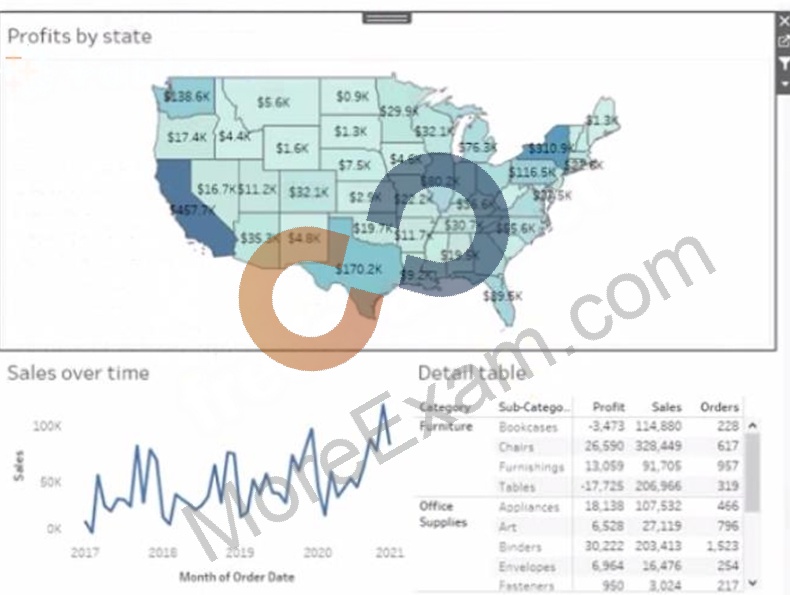
Question29: You have the following dashboard.Currently the map is used as a filter that affects the data on the otter sheets of the dashboard You need to configure the dashboard to ensure that selecting a data point on the map only tillers the Detail table What should you do?
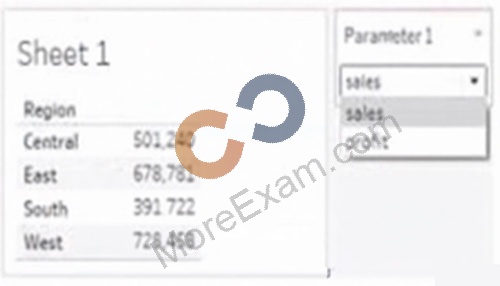
Question30: You have the following dataset.You need to create the following worksheet.The table must show either profit or sales based on the selection from the Parameter 1 menu.Which three actions should you perform in orders(Place the three correct options in order Use the arrows to move Options lo Answer Area Use Answer Area arrows to reorder the options)
Question31: You publish a dashboard tut uses an attract. The extract refreshes every Monday at 10:00.You need to ensure that the extract also refreshes on the last day of the month at 18:00.What should you do?
Question32: You have a blank dashboard.You want to add two sheets to the dashboard. The sheets must support the Show/Hide button.To which two objects can you add the sheets? (Click the two appropriate Options in the Answer Area.)
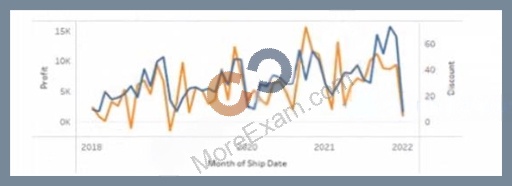
Question33: You have the following chart that shows profits and discounts over time.You need to combine the lines to appear as shown in the following chart.What should you do?
Question34: You have the following worksheet.
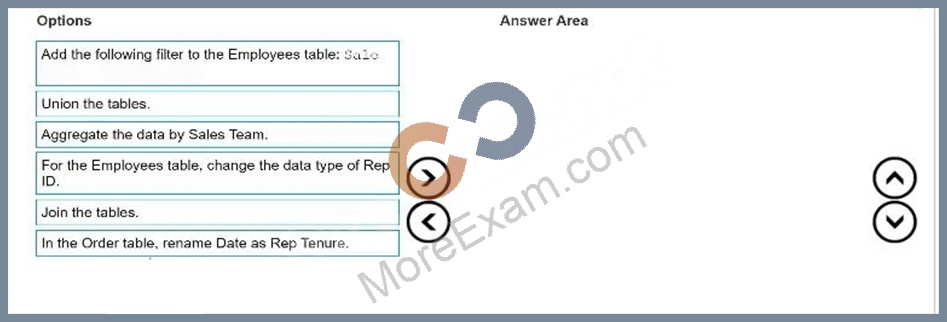
Question35: You are developing a data source in Tableau Prep.You have two tables named Orders and Employees.The Orders table was created in 2019 and contains the following columns.The Employees table contains all the employee information for the various sales teams in the sales department and contains the following columnsYou want to prepare the data so that you can analyze sales trends over time for every sales team.Which three actions should you perform in order? (Place the three correct options in order. Use the arrows to move Options to Answer Are a. Use Answer Area arrows to re-order the options.)
Question36: You have a workbook that connects to a database. The database requires authentication.You plan to publish the workbook and schedule a daily refresh of the data.Which two conditions must be met to schedule the refresh? Choose two.
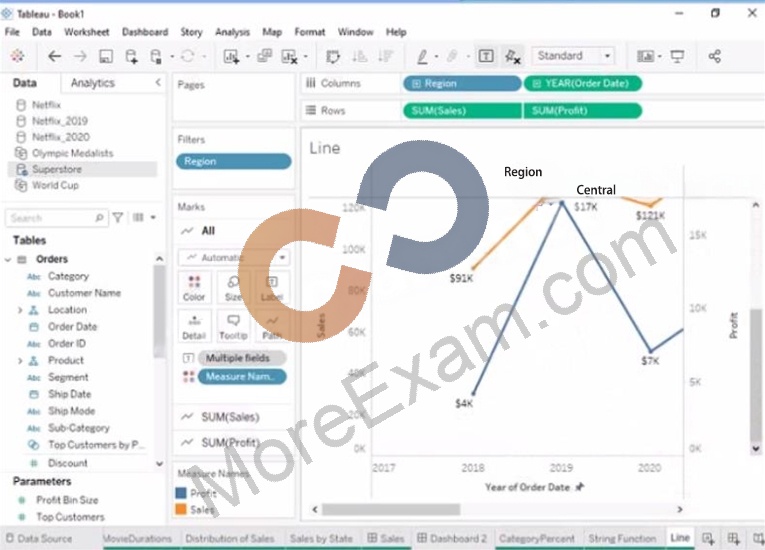
Question37: Open the link to Book1 found on the desktop. Open the Line worksheet.Modify the chart to show only main and max values of both measures in each region.
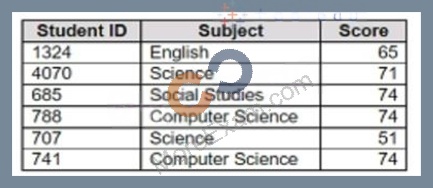
Question38: You have the following dataset.You want to create a new calculated dimension field named Category that meets the following conditions:. When Subject is Computer Science or Science, Category must be Sciences.. When Subject is English or Social Studies, Category must be Humanities.Which two logical functions achieve the goal? Choose two.
Question39: You have a sales dataset that contains the following fields.You need to analyze the average revenue per product in different regions over time.Which two fields should be measures? Choose two.
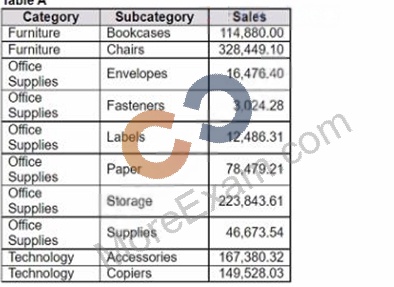
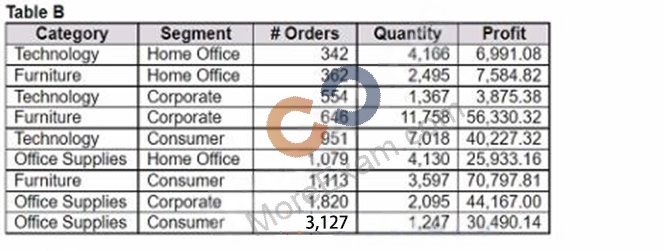
Question40: You have the following two tables.Table A is the primary table.Which type of join is established when a blend is created by using the join key of Category?
Question41: You publish a dashboard that uses an extract. The extract refreshes every Monday at 10:00.You need to ensure that the extract also refreshes on the last day of the month at 18:00.What should you do?
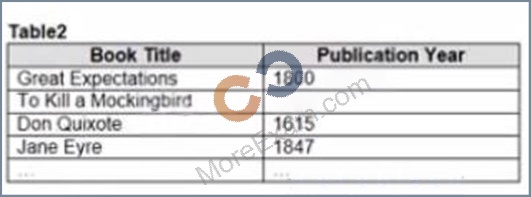
Question42: You have the Mowing two tables that contains data about the books in a library.Both tables are incomplete so there are books missing from the tables.You need to combine the tables. The solution must ensure that all the data is retained Which type of join should you use?
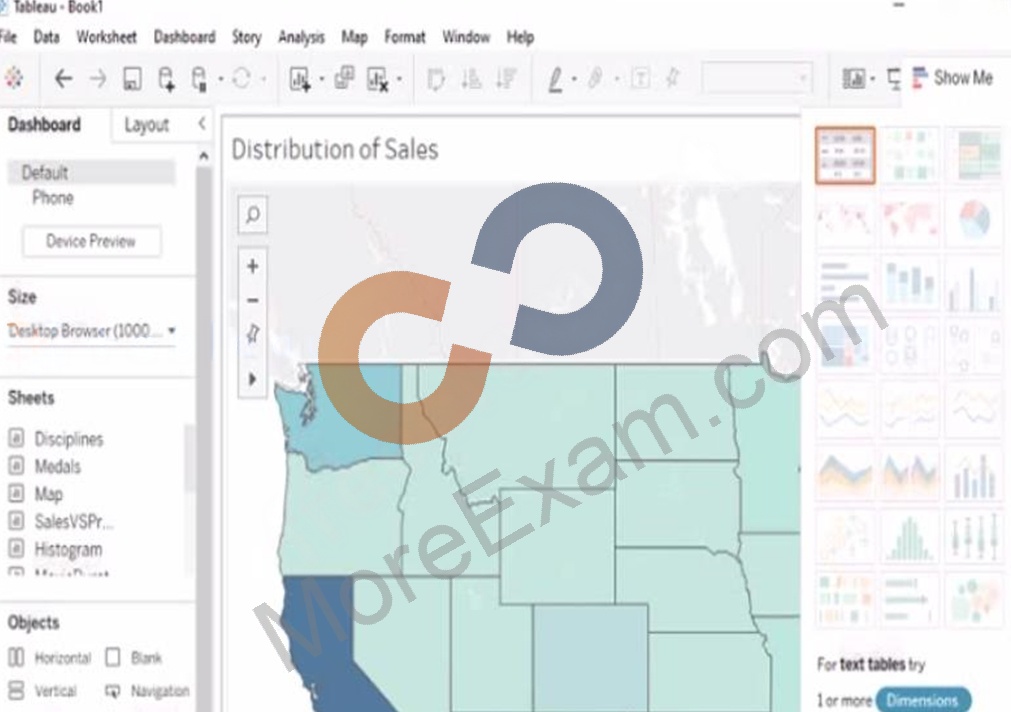
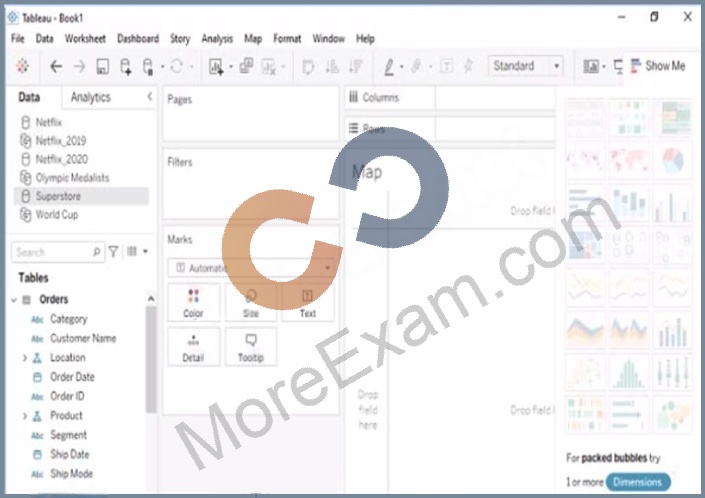
Question43: Open the Link to Book1 found on the desktop. Open Map worksheet and use Superstore data source.Create a filed map to show the distribution of total Sales by State across the United States.
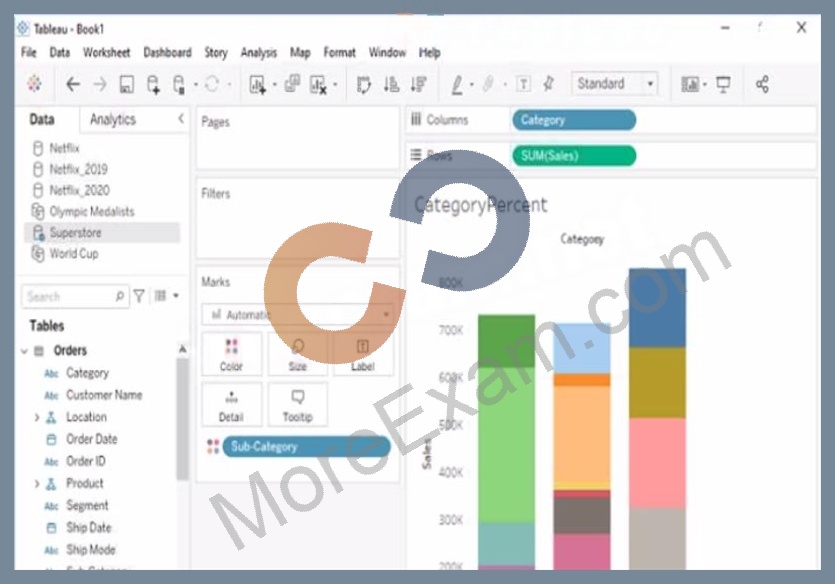
Question44: Open the link to Book1 found on the desktop. Open the CategoryPercentage worksheet.Modify the bar chart show the percentage of sales for each Subcategory within every Category. The total percentage for every Category must be 100%.
Question45: You need to change the values of a dimension without creating a new field.What should you do?
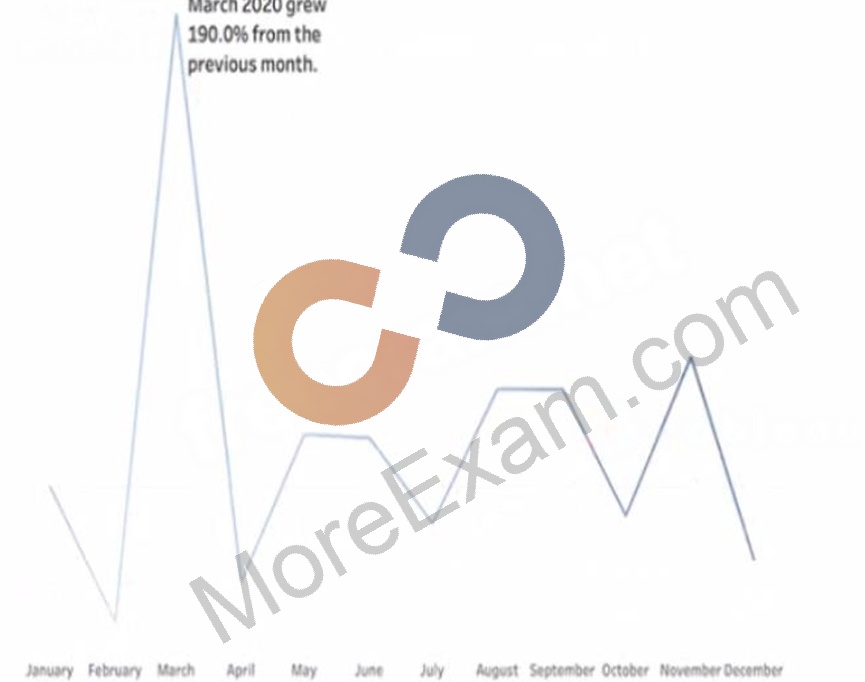
Question46: You have a line chart on a worksheet.You want to add a comment to March 2020 as shown in the following visualization.What should you do?
Question47: You are creating a new dashboard.You need to add a button to the dashboard that allows users to export the dashboard as an image.Which type of object should you use?
Question48: You want to create the following dashboard that will contain two sheets.What should you do?